
The name of the industry is unique. It is defined as “the collection of competitors that produces similar or substitute products or services to a defined market”. Another term is “Industry Segments” which is formed as the products or services of the industry are targeted to particular subsets of the general market. Whether it’s an industry or a segment, it’s still referred to as “the industry”.
The code of an industry provided by ISIC. The International Standard Industrial Classification of All Economic Activities (ISIC) is the international reference classification of productive activities. Its main purpose is to provide a set of activity categories that can be utilized for the collection and reporting of statistics according to such activities. It provides a comprehensive framework within which economic data can be collected and reported in a format that is designed for purposes of economic analysis, decision-making, and policy-making. The classification structure represents a standard format to organize detailed information about the state of an economy according to economic principles and perceptions. These economic activities are subdivided in a hierarchical, four-level structure of mutually exclusive categories, facilitating data collection, presentation, and analysis at detailed levels of the economy in an internationally comparable, standardized way.
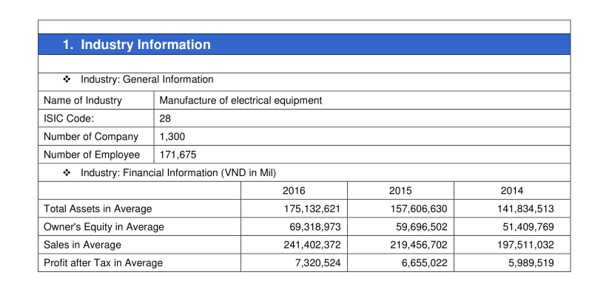
Number of Company provides the total numbers of company in the industry. Sometimes a firm has literally thousands of competitors who share the same market with it. Therefore, those competitors are always treated as a class or in categories. However, it only has a small number (less than 10) of key competitors (usually focusing on 3-5 of them) which go into as much detail on these as possible.
The Number of Employee is defined as the number people engaged in productive activities in an Industry. The concept includes both employees and the self-employed and the two main measures used for Number of Employee are the number of persons employed and/or the number of vacancies.
Total Assets in Average is also known as Averages total assets. It is the average book value of Industry’s assets over the different reporting date. Normally, the value of assets at the reporting date is shown in the balance sheet of the entire Industry. These assets including book current and fixed assets. Averages total assets is normally uses to assess the return on averages assets which is assessing the efficiency of using assets for the two or more consecutive time. For example, the government might want to assess the return on averages assets for the last three years. Indeed, To assess this, Industry need to measure the amount of net income for that three years and then calculate the averages of total assets. These averages of total assets are the value of assets that use by all companies in the market to support their sales and operation.
Owner's Equity in Average is an averaging concept used to smooth out the results of the return on equity calculation. This concept yields a more believable return on equity measurement. The Owner's Equity in Average calculation is the beginning shareholders' equity plus the ending shareholders' equity, divided by two. The concept is most useful when measuring the return on investment in a period in which an industry has sold a large amount of stock. In this case, the ending Owner's Equity figure will be much higher than the beginning figure, which results in a substantially lower return on equity calculation. If there are few stock sales over time, this means that a trend line of return on equity measurements will reveal a sharp dip in any period in which stock is sold, even if the overall returns of the industry are approximately the same over time.
Sales in Average is also known as Average sales. No matter what industry we focus on, any sector that deals with customers will have to keep track of its sales. When we need a quick way to monitor the industry’s success in meeting objectives, sales provide one of the easiest metrics as it is a direct display of efficiency related to profits. Even so, raw sales data can be overwhelming and may not always paint the clearest picture. Using average sales across different periods can give us a better idea of how well the industry sales are performing, what tactics are connecting with consumers. More importantly, it gives us a straightforward way to establish a standard for measuring success and failure. Calculating average sales is an uncomplicated process and can help steer our business decisions for greater success.
Average profit after tax shows how well companies in an industry performed through its core operations, net of taxes. The figure doesn't include one-time losses or charges; these don't provide a true representation of a company's true profitability. Some of these charges may include charges relating to a merger or acquisition, which, if considered, don't necessarily show an accurate picture of the company's operations, even though they may affect the company's bottom line that year. Analysts look at many different measures of performance when assessing a company as an investment. The most commonly used measures of performance are sales and net income growth. Sales provide a top-line measure of performance, but they do not speak to operating efficiency. Net income includes operating expenses but also includes tax savings from debt. Net operating profit after tax is a hybrid calculation that allows analysts to compare company performance without the influence of leverage. In this way, it is a more accurate measure of pure operating efficiency.


")


")
")
")
")
")
")
")
")
")